
Intellect™
SCHEDULE MENU OPTIONS

Appointment
Full Day
Tab Options
Graphs Tab
This option plots graphs for the number of appointments for selected dates and the selected parameter (Appointment Type, Doctor, or Facility).
Selecting the Graphs Tab displays two frames featuring a large Graph Display Area, and a graph design frame. The graph design frame is further divided into the areas of Selection Indicators, Date Range, and Survey, Specific Graph Components, and Graph Type Selector, as shown below:
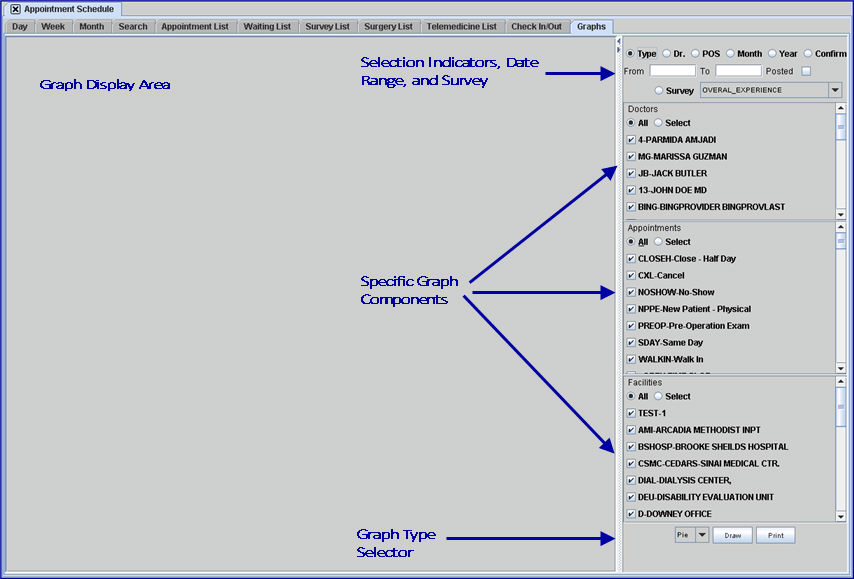
After graphs have been plotted, they are displayed in this area to be previewed before they are printed.
Intellect offers three types of graphs: Pie, Bar, and Line. A sample and brief description of each type of graph follows.
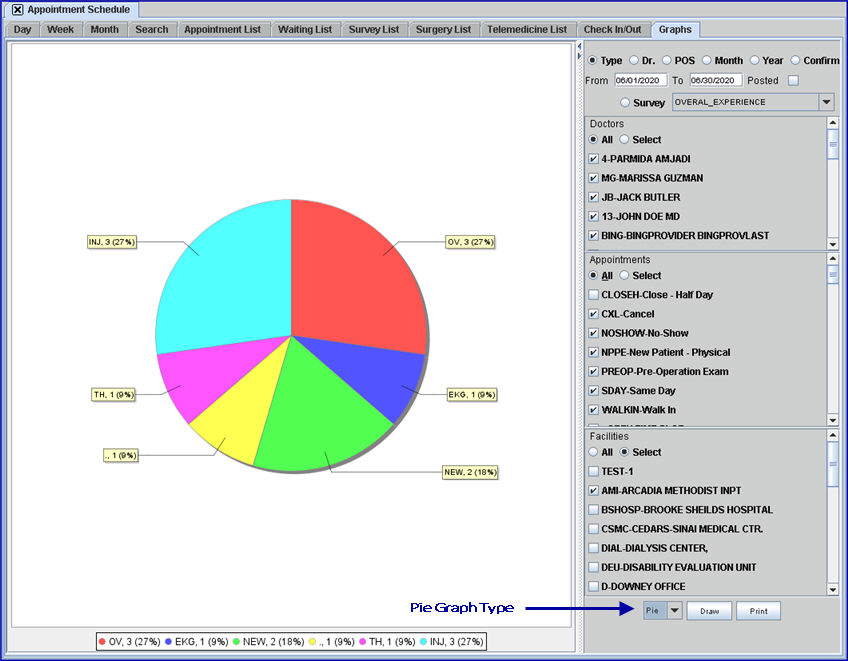
The Pie Graph creates a segment for each selected parameter, sized to its portion of all appointments. Each segment has a label attached with the code of the selected parameter, the amount of appointments for the segment, and the percentage of the total appointments for the date range.

A legend appears at the bottom of the screen indicating the code, amount of appointments, percentage of total, and color of the selected parameters segment.
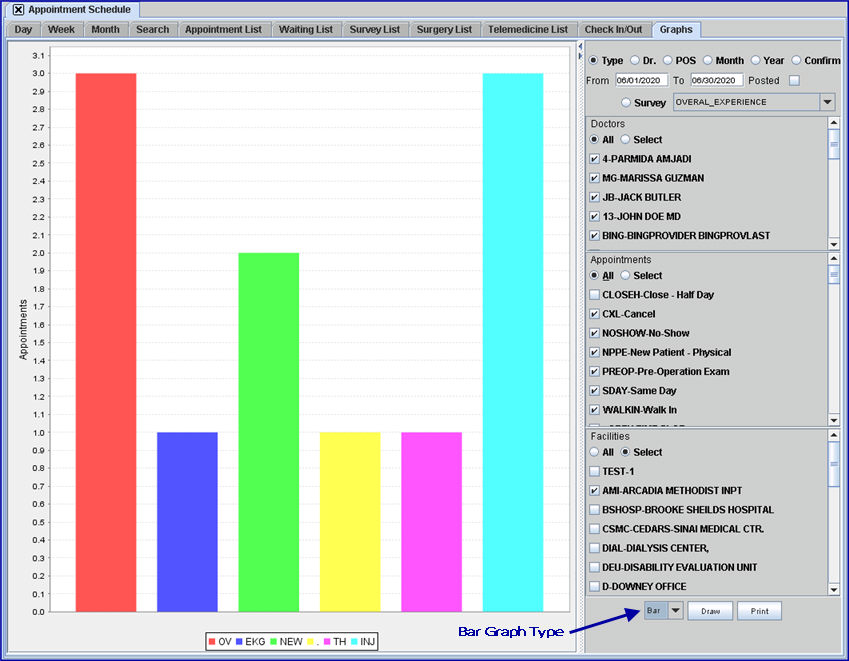
The Bar Graph uses the vertical (up) axis for appointment count to plot against the selected parameter (Appointment Type, Doctor, or Facility) which is the horizontal axis (across). A legend appears at the bottom of the screen indicating the code and color of the selected parameter.
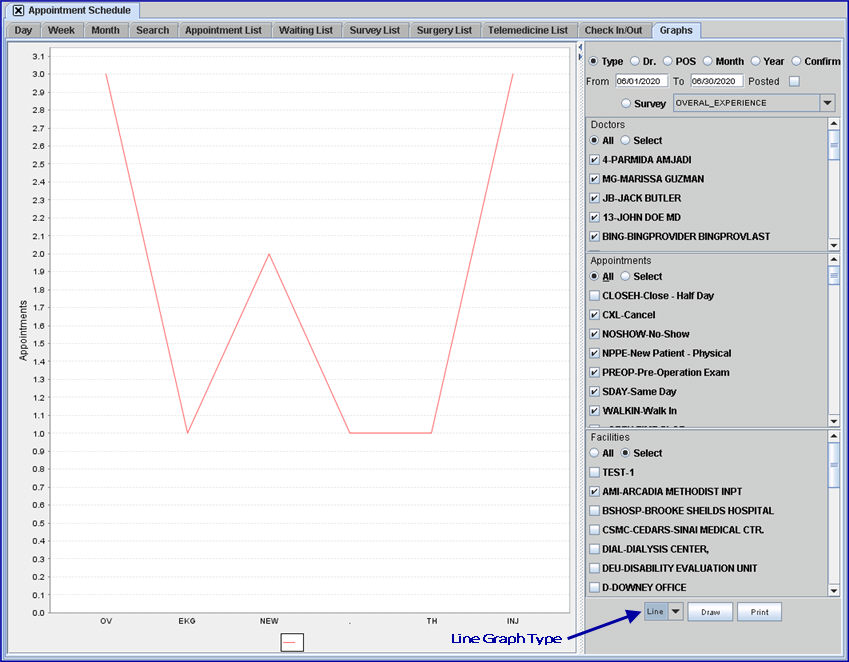
The Line Graph is similar to the Bar Graph in that it uses the vertical (up) axis for appointment count to plot against the selected parameter (Appointment Type, Doctor, or Facility) which is the horizontal axis (across).
The graph design frame, shown below, is divided into the areas of Selection Indicators, Date Range, and Survey, Specific Graph Components, and Graph Type Selector. Information for each section follows.
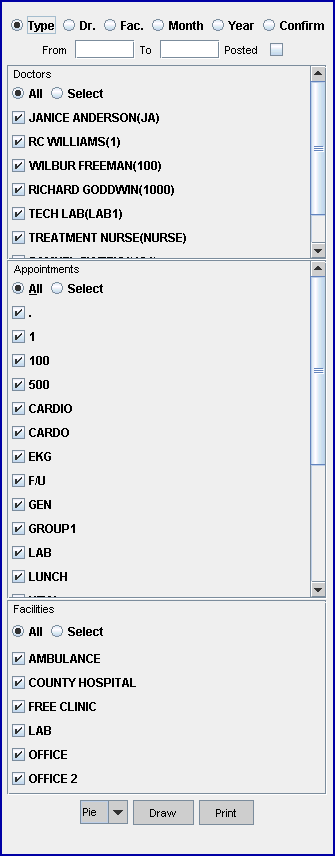
1. Selection Indicators, Date Range, and Survey

1.1 Selection Indicator Radio Buttons ![]()
1.1.1 Select the option to plot against the number of appointments.
1.1.2 Accept the default Type (Appointment Type) OR click a radio button ![]() to make an alternate selection.
to make an alternate selection.
1.1.2.1 Type: Selects and displays graph data based on Appointment Type. See step 2.2 for additional information.
1.1.2.2 Dr: Selects and displays graph data based on Doctors. See step 2.1 for additional information.
1.1.2.3 Fac: Selects and displays graph data based on Facilities. See step 2.3 for additional information.
1.1.2.4 Month: Selects and displays graph data based on months; i.e., January, February, March, etc. based on the set up of the Doctors, Appointments, and Facilities components.
1.1.2.5 Year: Selects and displays graph data based on years; i.e., 2008, 2009, 2010 based on the set up of the Doctors, Appointments, and Facilities components.
1.1.2.6 Confirm: Selects and displays graph data based on appointment confirmation information; i.e., busy, cancelled, confirmed, error, invalid phone number, no answer, rescheduled, and other. It is based on the set up of the Doctors, Appointments, and Facilities components
1.2 Date Range ![]()
1.2.1 Enter the beginning and ending dates to calculate the number of patients for the graph.
1.2.2 Leave blank to include all dates.
1.3. Posted ![]()
1.3.1 Used to graph only appointments which result in charges being posted.
1.3.2 This option may be used to filter all other selections and date ranges.
1.3.3 Check the ![]() Posted box to enable.
Posted box to enable.
1.4.1 Effective version 14.03.20. Surveys may be automatically emailed to patients regarding the services they received at their last appointment. Surveys are emailed to all patients the day after their appointment (see sample email). The questions in the survey are standard, with options of Excellent, Good, Fair, and Poor (see sample survey).
1.4.2 Set up is required before this feature may be used. Please see Schedule --►Appointment --►Full Day --►Survey List tab for set up information.
1.4.3 Click the Survey radio button ![]() to select and display graph data based on patient survey results.
to select and display graph data based on patient survey results.
1.4.4 Use the drop-down option to select and display graph data based on an individual survey question:
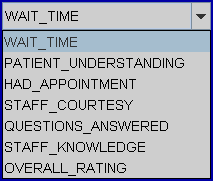
The drop-down options correlate to the individual survey questions. The default is WAIT_TIME, which correlates to question 2. How long did you have to wait before you were seen?
1.4.5 When the Survey radio button ![]() has been selected, the graph may be further defined using any of the selection indicators and date range, using specific graph components to refine the selected indicators, and by using the graph type selector to indicate the format of the graph (i.e., pie, bar, or line).
has been selected, the graph may be further defined using any of the selection indicators and date range, using specific graph components to refine the selected indicators, and by using the graph type selector to indicate the format of the graph (i.e., pie, bar, or line).
.
2.1.1 Having the Selection Indicator Radio Button for 'Doctor' selected (see section 1.1.2.2 above) gives the option of plotting the graph for all Doctors or any one or more doctors.
2.1.2 Accept the default '![]() All', OR check the radio button '
All', OR check the radio button '![]() Select', and then check the desired
Select', and then check the desired ![]() Doctor(s).
Doctor(s).
2.2.1 Having the Selection Indicator Radio Button for '![]() Type' selected (see section 1.1.2.1 above) gives the option of plotting the graph for all Appointment Types or any one or more type.
Type' selected (see section 1.1.2.1 above) gives the option of plotting the graph for all Appointment Types or any one or more type.
2.2.2 Accept the default '![]() All', OR check the radio button '
All', OR check the radio button '![]() Select', and then check the desired
Select', and then check the desired ![]() Appointment(s).
Appointment(s).
2.3.1 Having the Selection Indicator Radio Button for '![]() Facility' selected (see section 1.1.2.3 above) gives the option of plotting the graph for all Facilities or any one or more.
Facility' selected (see section 1.1.2.3 above) gives the option of plotting the graph for all Facilities or any one or more.
2.3.2 Accept the default '![]() All', OR check the radio button '
All', OR check the radio button '![]() Select', and then check the desired
Select', and then check the desired ![]() Facility(s).
Facility(s).
![]()
3.1 [Pie] (Graph Type) ![]()

3.1.1 Select the desired graph type from the drop-down list.
3.1.2 Accept the default 'Pie,' OR make an alternate selection.
3.2 [Draw] ![]()
3.2.1 Click the [Draw] button to initialize OR refresh the graph.
3.3 [Print] ![]()
3.3.1 Click the [Print] button to print the graph.
3.3.2 Click the [Print] button to display a Print Dialog Box. See sample:
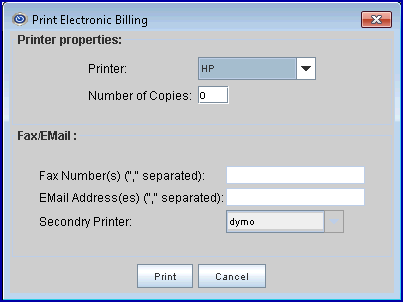
3.3.2.1 Printer Properties:
3.3.2.1.1 Printer: The default printer for the logged-in clinic and password is selected. To select a different printer, either click on the arrow, OR press the → (right arrow) on the keyboard to view the list of printer codes. In our example, the defaulted Printer is HP. This is just an example of a printer name and may or may not be set up on the system.
To select the printer type, click on the code, OR use the ↑ (up) and ↓ (down) arrows to highlight the correct code; then press the [Enter] key to select.
Note: It is suggested that graphs be printed to a color printer.
3.3.2.1.2 Number of Copies: This field defaults to either 0 (zero) or 1. Both print 1 copy. To print more than one copy, enter the number of copies.
3.3.2.2 Fax/Email:
In addition to printing reports, Intellect provides the capability to export reports to an Excel spreadsheet, Email, Fax, Disk, or Archive. A secondary printer may also be selected, if one is set up, by clicking on the arrow to display the drop-down list.
Note: The Secondry Printer option is not used with graphs.
3.3.3 Select the [Print] button to send the request to the printer (or as a Fax or email).
3.3.4 Select the [Cancel] button to clear the screen and return to the graph screen without saving or printing.