
Intellect™
SAMPLE MANAGEMENT DETAIL REPORTS

Scroll through the samples, OR click on a specific report title to view its' sample:
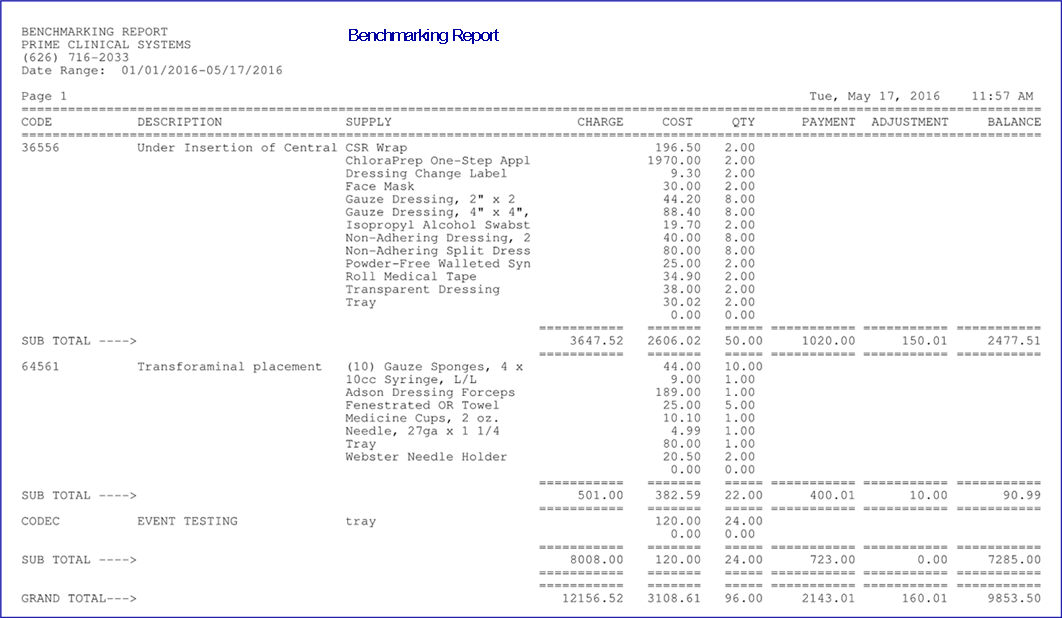
Benchmarking Report Effective version 16.05.20
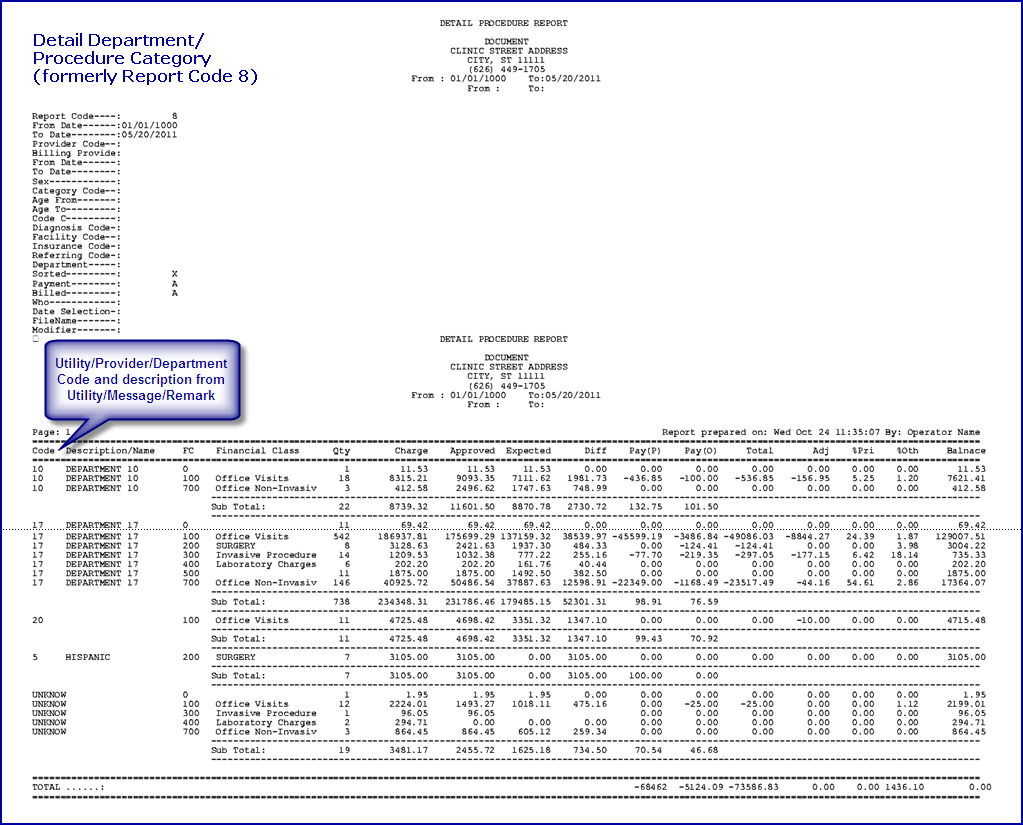
Detail Department/Procedure Category
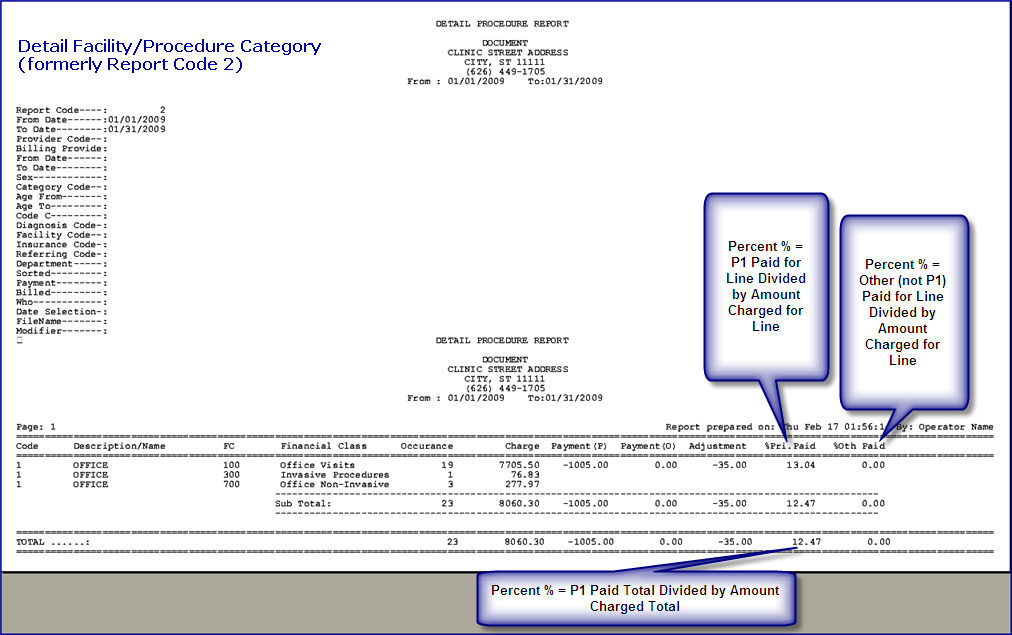
Detail Facility/Procedure Category
Detail Patient Category/Procedure Category
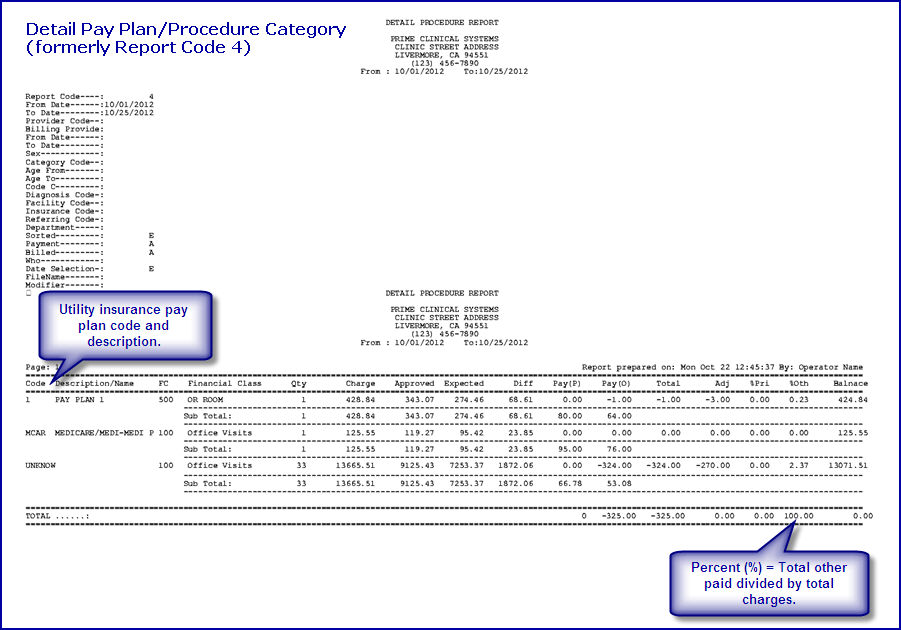
Detail Pay Plan/Procedure Category
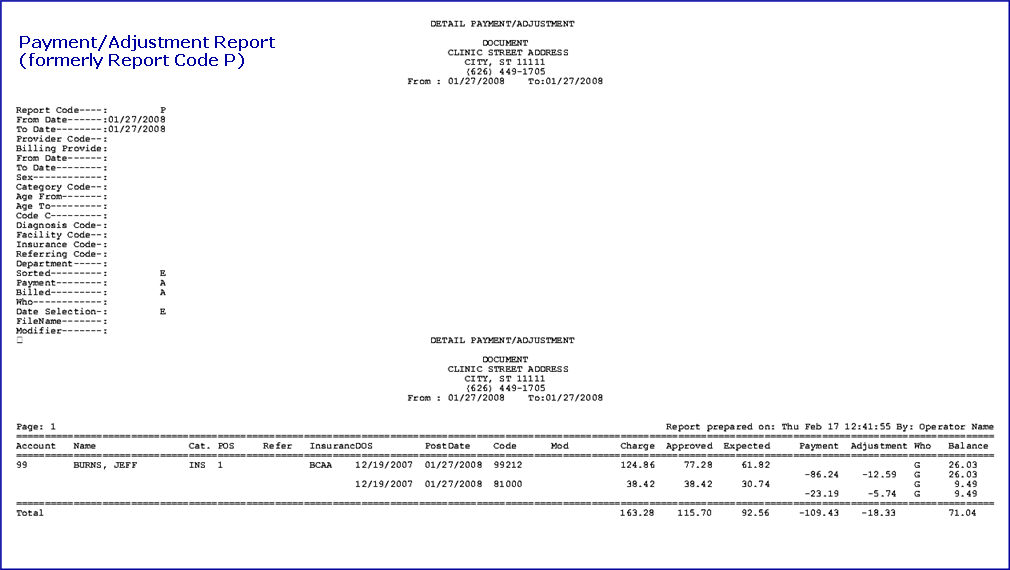
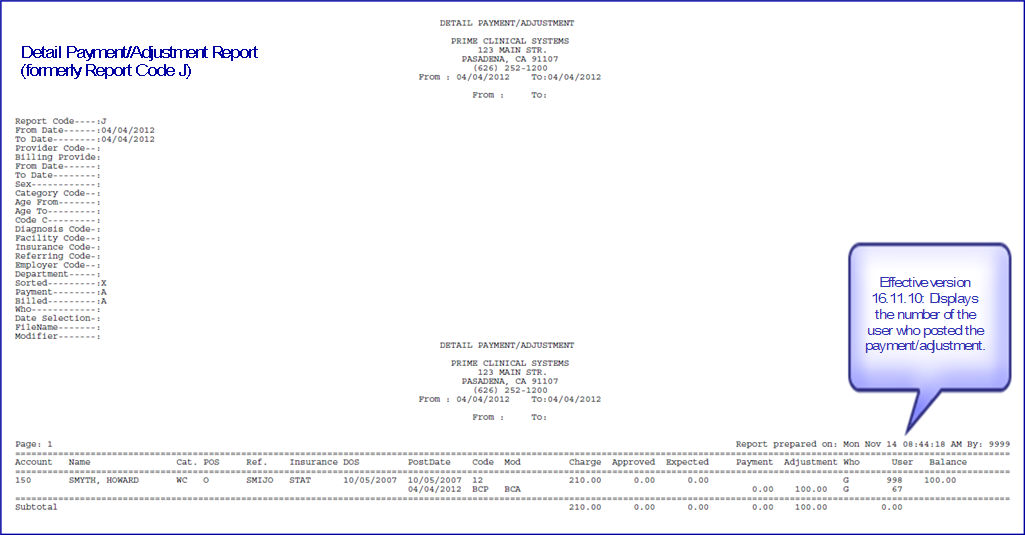
Detail Payment/Adjustment Report
Detail Primary Insurance/Procedure Category
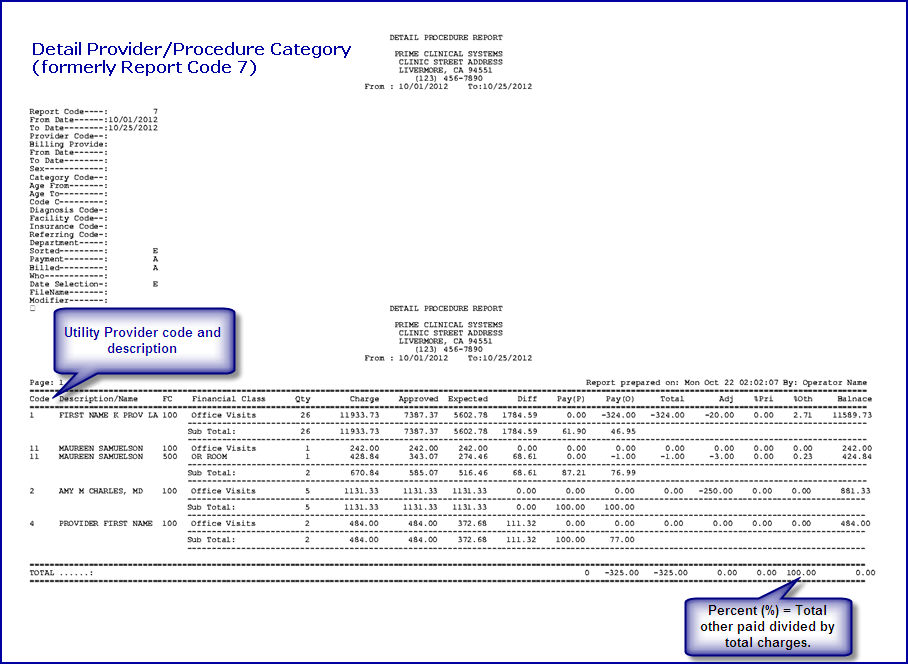
Detail Provider/Procedure Category
Detail Referring/Procedure Category
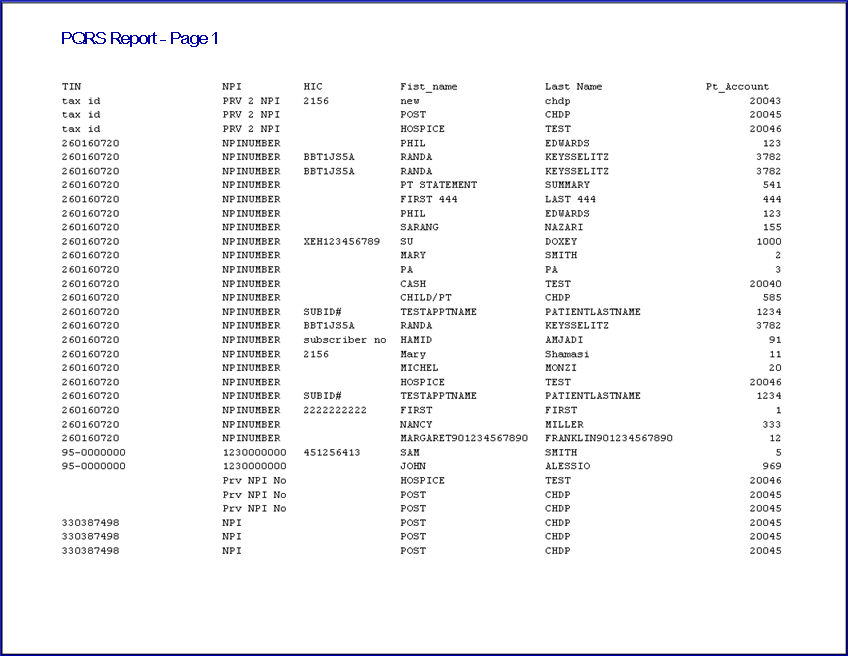
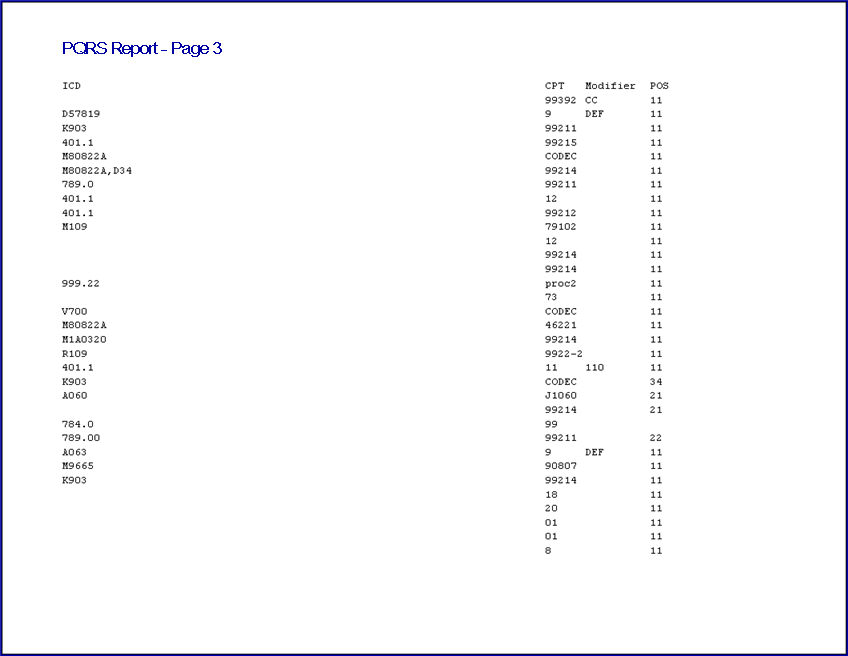
PQRS/Quality Report (Note: Instead of printing, this report allows Medicare information to be saved to an Excel format via the Print Dialog Box by selecting EXCEL from the <Printer> field drop-down list, naming it as specified by the requester, and subsequently saving it where desired.
Productivity Facility/Procedure Code
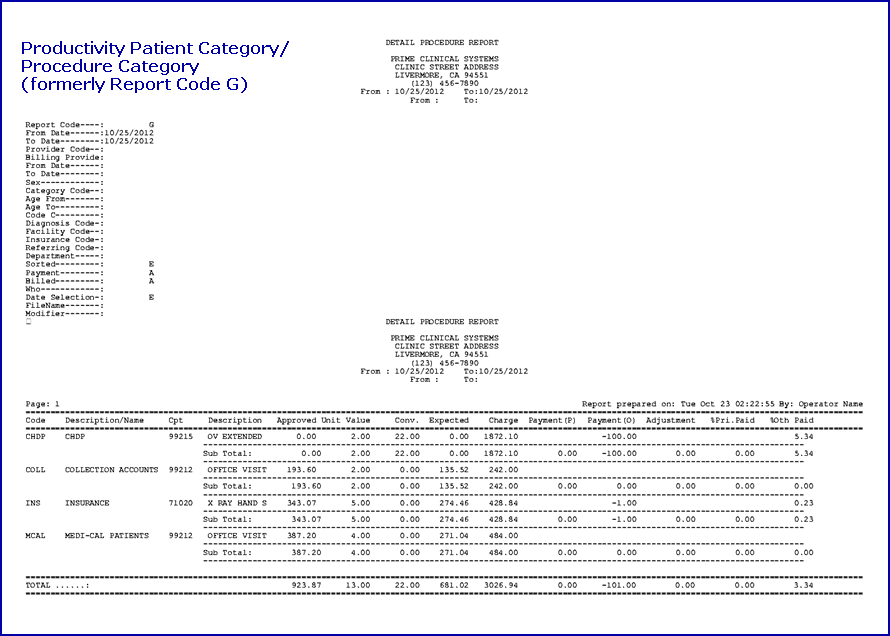
Productivity Patient Category/Procedure Category
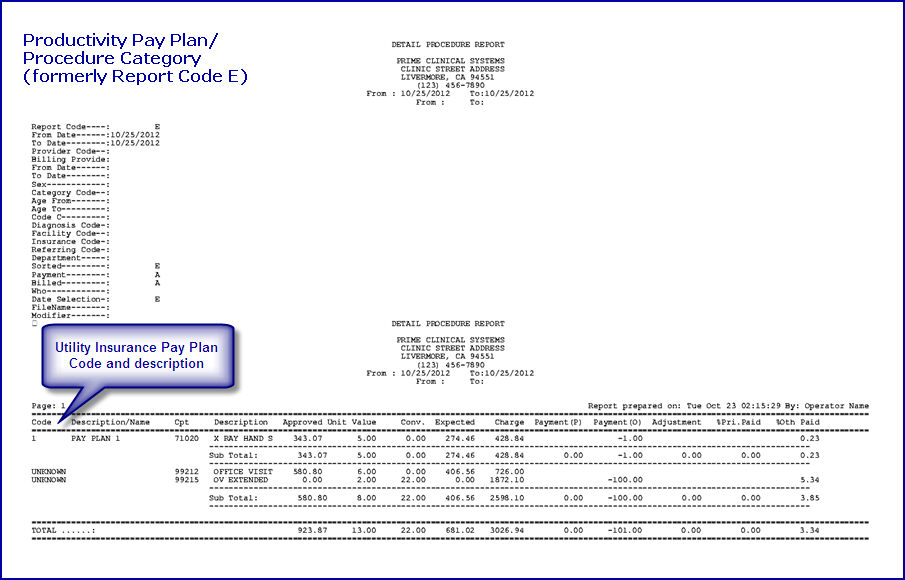
Productivity Pay Plan/Procedure Category
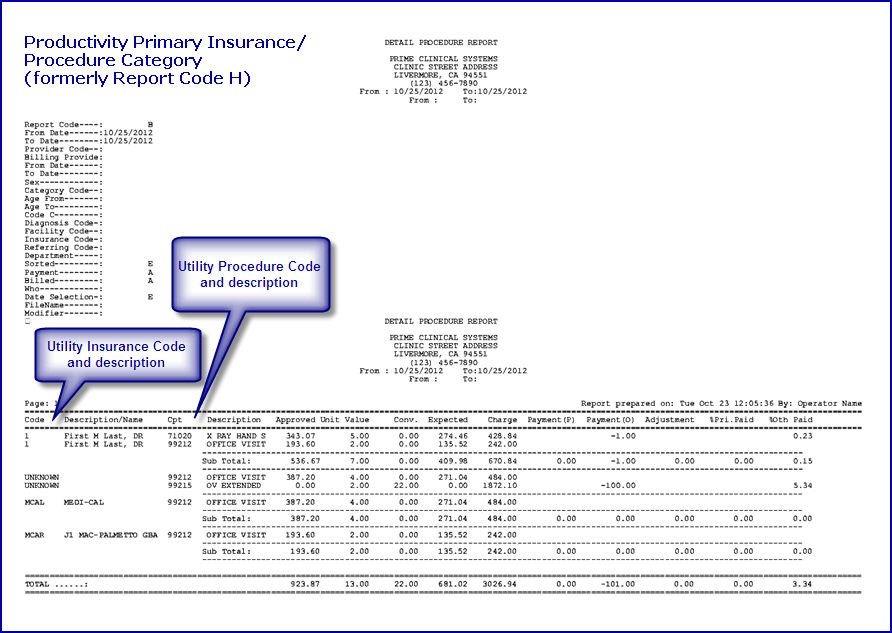
Productivity Primary Insurance/Procedure Category
Productivity Provider/Procedure Category
Productivity Referring/Procedure Category
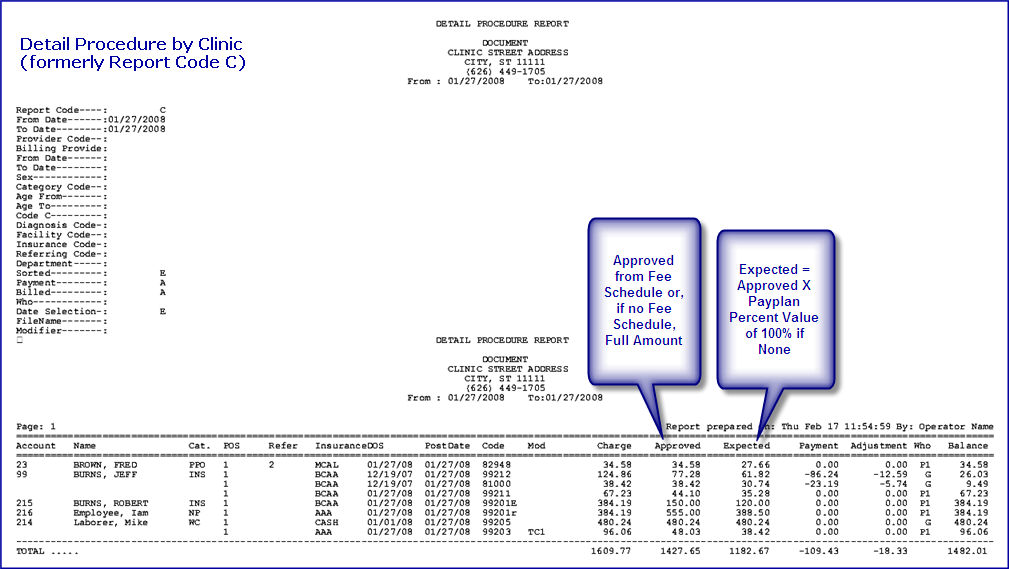
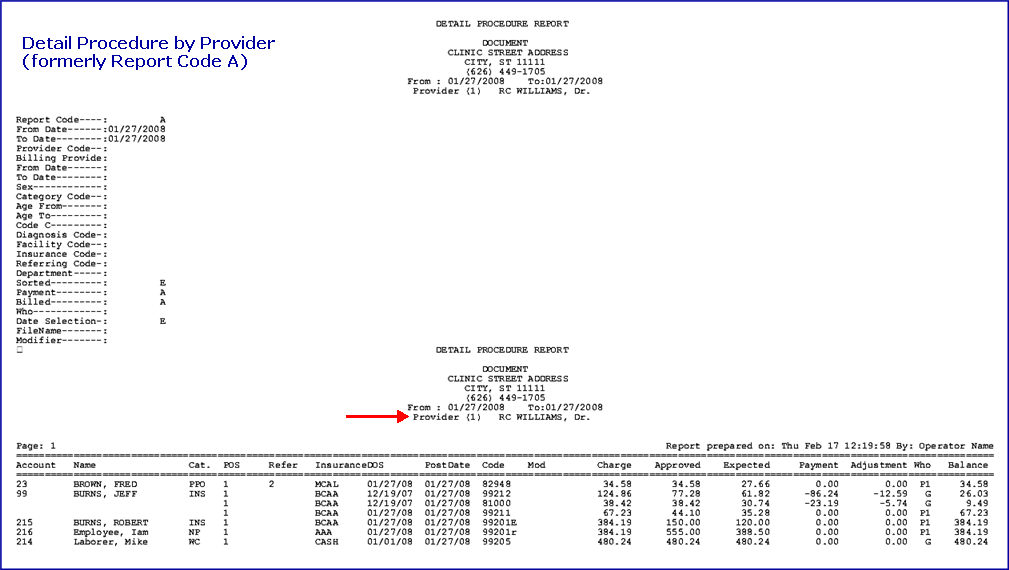
The following sample output represents posting of $1878 in charges for various procedures, for patients, by 2 providers by different sources of payment.
All patients had a single visit and a single procedure performed.
There has been $1463. in Payments and $110. in Adjustments
Effective version 19.01.18, the Name of the Report in the report header coincides with the <Report Code> drop-down selection:


For information on requesting reports and selecting/filtering data, see:
• Management --►Detail --►Detail Report
• Management --►Detail --►Detail Report - Field Summary






Version 9.12.14 - New Columns:
To provide more information, three columns were added to the Detail Aging by Provider and Detail Aging by Clinic reports.
The columns are Who, PINS (Primary Insurance Code), SINS (Secondary Insurance Code) and Cat (Category).

Version 9.12.14 - New Columns:
To provide more information, three columns were added to the Detail Aging by Provider and Detail Aging by Clinic reports.
The columns are Who, PINS (Primary Insurance Code), SINS (Secondary Insurance Code) and Cat (Category).
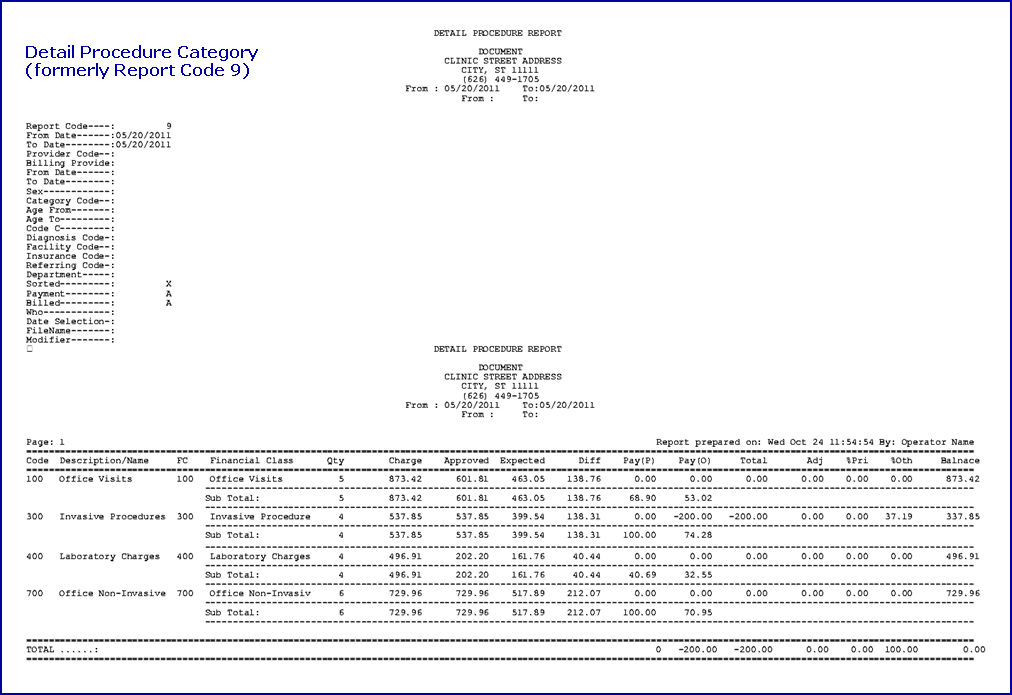
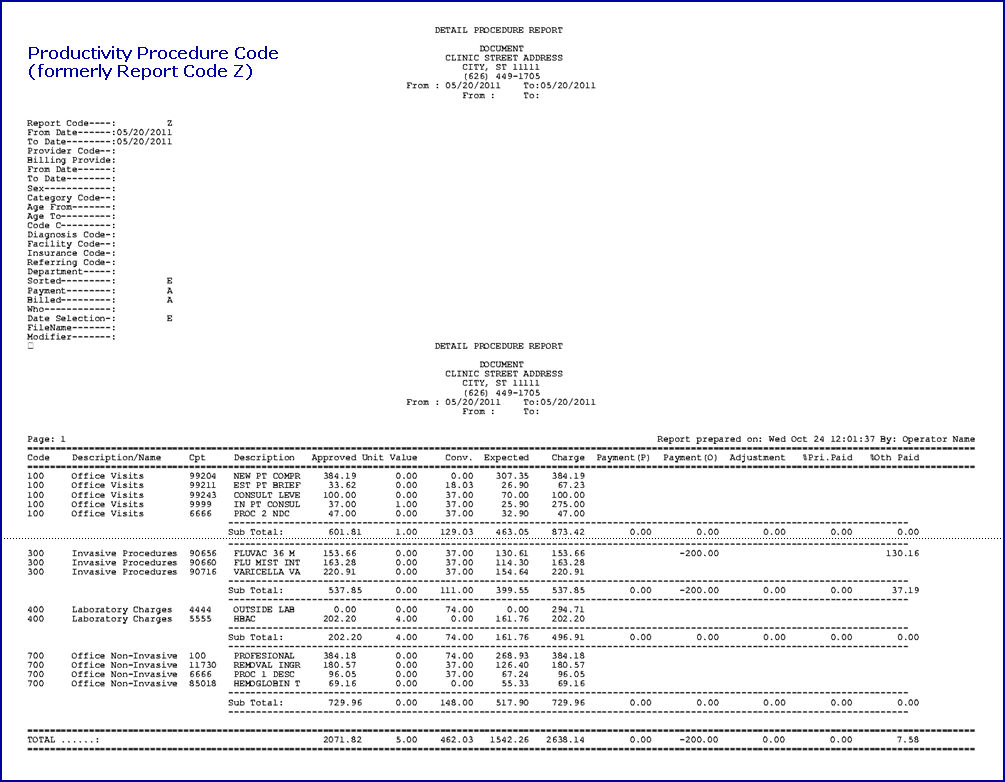
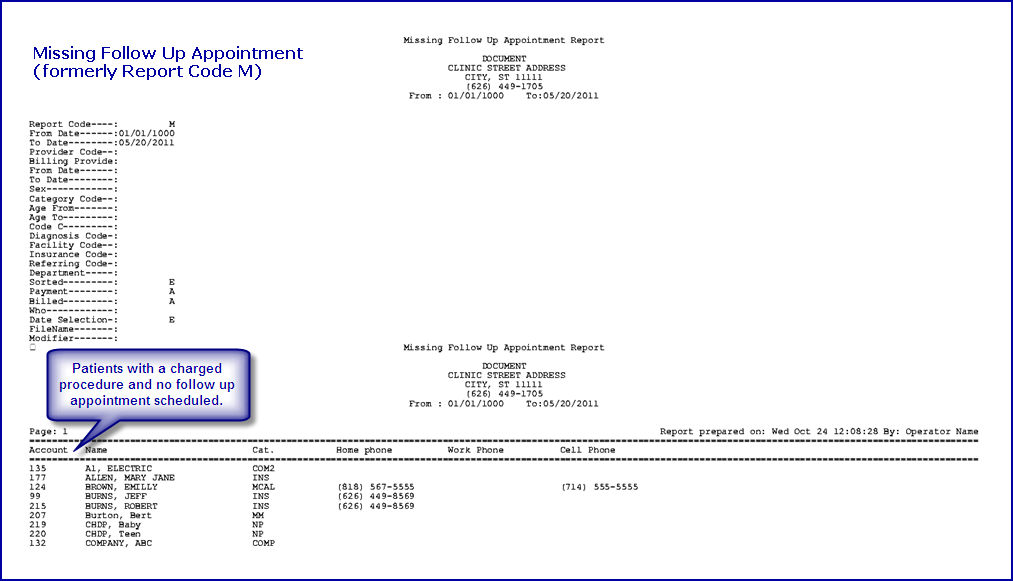
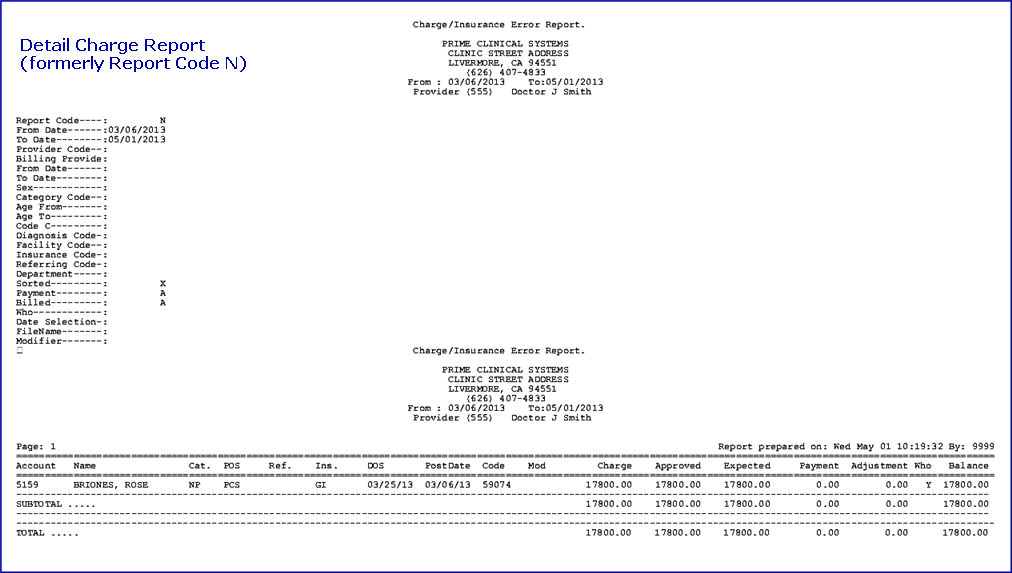
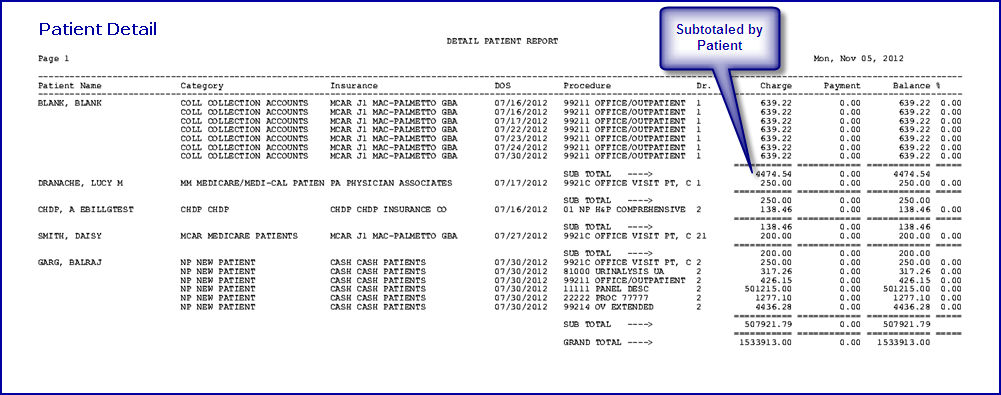
Older software versions may still have the following report. It is no longer available in more current software versions.
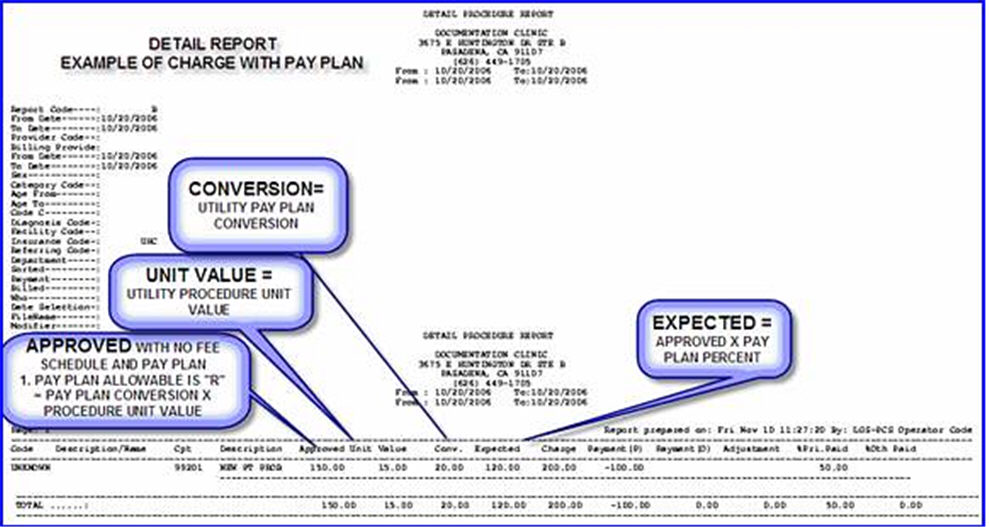

Column Definitions:
Charge: Total Charges posted towards the Panel Code.
Cost: Total Cost Per item. When the procedure is performed more than 1 time per report, this amount is the 'total cost' multiplied by 'QTY.'
Example: For the tray, the cost per each is $80.00. If the panel is posted 2 times, then the Total Cost for the tray = $160.00 and the QTY = 2.
Payment: Total Payment posted against the Panel Code.
Adjustment: Total Adjustment posted against the Panel Code.
Balance: Total Balance of the Charge-payment/adjustment.
For information on requesting reports and selecting/filtering data, see:
• Management --►Detail--►Detail Report
• Management --►Detail--►Detail Report - Field Summary